Sunday, February 24, 2019

Week 8 - activities on Soybean


Soybean set out to close the week with minor gains after continuous plummet last week juiced by pessimism over the U.S.-China trade negotiations (Bloomberg). As a result, supply outnumbered demand forcing the price to a continuous decline. But now, the gains are also coming because China had agreed to buy an additional 10 million metric tons of soybeans. On the other hand, part of the report says China has long term plans to expand soybean crop and farm subsidies to cut reliance on US imports (South China Morning Post). This information has created so much uncertainty in the market.

Prior to the US/China trade negotiation, Soybeans price for March 2019 Futures contract was 902,40 USd and 109,003 volume of trades. Right after the negotiation, the market found confidence in the commodity and price surged to 911,00 USd, 146,573 volume of trades and settled 910,25 USd on Friday. The chart below depict the weekly swings in the price of Soybean March 2019 Futures Contract.


Although there is unclear trend in the market, in our best of knowledge we hope the outcome of the negotiation will attract new investors in the market and release pressure on sellers who were in the market last week to sell their crop before the negotiation goes bad. Hence, price may go up a little bit in the coming week.


References:
1. https://www.bloomberg.com/news/articles/2019-02-23/china-s-pledge-for-u-s-soy-buying-catches-traders-off-guard
2. https://amp.scmp.com/news/china/diplomacy/article/2187088/china-increases-land-soybean-crop-and-subsidies-farmers-effort
3. https://www.cmegroup.com/trading/agricultural/grain-and-oilseed/soybean_quotes_settlements_futures.html#tradeDate=02%2F22%2F2019



Sunday, February 17, 2019

Week 7 - General Information and Spot Prices of Soybean

A little introduction about Soybean/meal/oil

Soybean is an edible bean that is native to East Asia, however, it is widely grown and distributed from the United States and Brazil. There are 150 different types of soybean, although the most common is the yellow bean, with 2/3 of soybean processed into soybean oil or meal. Soybean meal is mainly used as a source of protein for livestock, but can also be used for human foods such as Soy-milk, flour and tofu. Soybean oil is used for cooking and is the most used oil in the US. Soybean is also one the most traded agriculture commodities where its main trading location is at the Chicago Mercantile Exchange (CME).

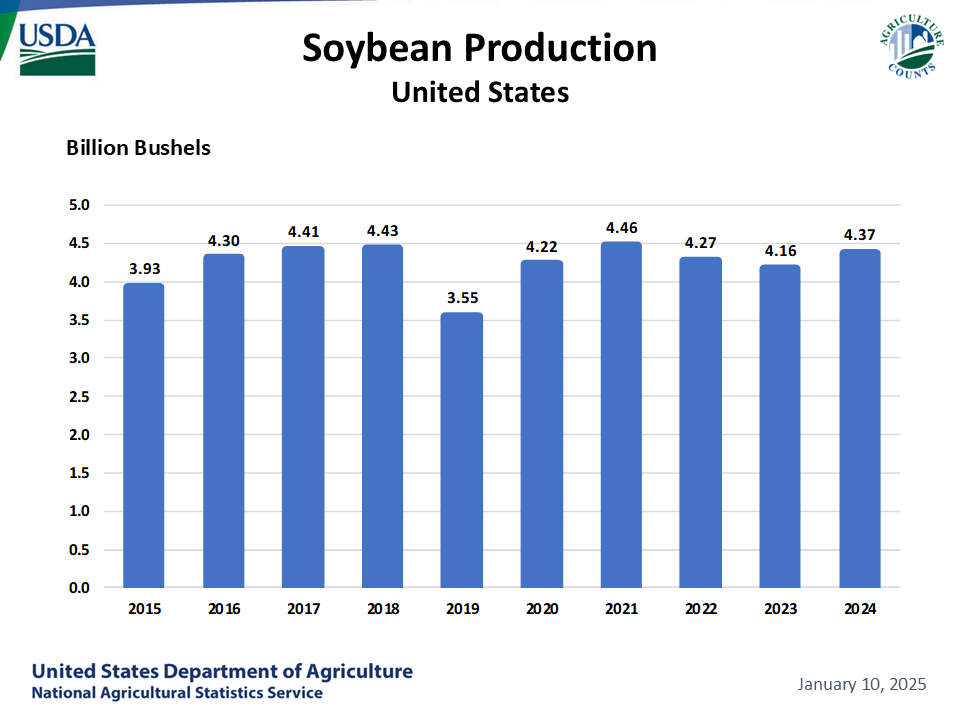
Soybeans: Production by Year, US

Exporters/importers of Soybean

The US and Brazil are the largest producers of soybean with the US producing over 100 million metric tons and Brazil over 80 million metric tons. On the other hand, Brazil were the largest exports of soybean, exporting over 70 million metric tons worldwide with the US exporting just over half of their production (as of 2018). The biggest importers of soybean were China, importing over $30billion worth throughout the year. The EU-27 imported a mere fraction of China standing at 15 million metric tons. The above graph shows soybean production in the United States since 1998 and as you can see, it has steadily grown (albeit with some minor decreases).

China vs US trade war on Soybeans

Image result for China vs Us trade war soybeanAs many will know, there is a huge war in action, the China vs US trade war. Both countries have put high tariffs worth billions of dollars on each others good. When it comes to soybeans however, it will affect the US more than it will China as they plan to cut the percentage of rations for hogs from 20% to 12% (27 million metric tons). This equates to over 80% of soybean imports from the US, meaning this would hit the US farmers hard. If no agreement between the two countries happens, then you could see a huge impact on US farmers not being able to sell their crops.


Soybean spot price fluctuations over the last 7 days

The chart shows how the spot price of soybean has been over the last few days (week 7). As you can see, the price started at around $9.15 per contract (5000 bushels) and had a decrease of over 10 cents over the next day. Between the 12th and 13th (February) it had a high increase towards the end of day trading and was over $9.15. This remained steady over the next couple of days before decreasing again to finish weekly trading 0.77% down at $9.14
Chart


Sources
Graph from USDA (United States department of Agriculture
https://www.nass.usda.gov/Charts_and_Maps/Field_Crops/soyprod.php 

Reuters - Inside Chinas Strategy in the Soybean Trade War
https://www.reuters.com/article/uk-usa-trade-china-soymeal-insight/inside-chinas-strategy-in-the-soybean-trade-war-idUSKCN1OQ0D2

Graph 2 - Soybeans price
https://markets.businessinsider.com/commodities/soybeans-price/usd

CME - Soybean 
https://www.cmegroup.com/trading/agricultural/grain-and-oilseed/soybean_contract_specifications.html

Picture - China Vs US 
https://www.google.com/search?rlz=1C1CHBD_en-GBGB781GB782&biw=1536&bih=732&tbm=isch&sa=1&ei=TltoXO_iK8yFk74P-YeUwAY&q=China+vs+Us+trade+war+soybean&oq=China+vs+Us+trade+war+soybean&gs_l=img.3...3353.5391..5577...0.0..0.84.519.8......1....1..gws-wiz-img.......0i30j0i24.mZ5cZ7xlo8g#imgrc=fCSLhtfMVk93IM: